Mosquitoes Bring Disease, Maybe Birth Defects, To US Border 12/2/15
This is disturbing and sad. A tropical disease that is spread by mosquitoes and that seems to be moving north—and may be approaching the US border—is being linked in health-agency reports to a disabling birth defect.
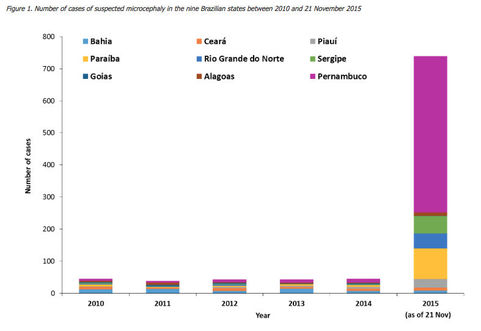
The disease is Zika virus, and the birth defect is microcephaly: smaller than normal heads in infants, due to the brain having stopped growing at some point in pregnancy. According to the World Health Organization, Brazil has reported739 cases of microcephaly among newborns in nine states in the “shoulder” of Brazil, the northeastern corner that protrudes into the Atlantic. Brazil’s Ministry of Health says there are more: 1,248 suspected cases, in 14 states. Seven children have died, and five others’ deaths are being investigated, according to the Ministry; one adult and one teenager have also died.
Only one child, who died, has been definitively diagnosed with the virus by tissue analysis, according to the Ministry’s statement. The agency has declared a national public health emergency and, in its most recent statement, says it hasasked the US Centers for Disease Control and Prevention to send a team to help.
Microcephaly can be caused by many things; according to the US National Institute of Neurological Disorders and Stroke, they include exposure to toxins during pregnancy, excessive drug or alcohol use, and a range of infections such as rubella and chickenpox. And it’s not unknown in Brazil, but according to the Ministry’s web site, the country has had only between 139 and 175 cases per year in each of the past five years—so this spike, whatever is causing it, is almost 10 times as many.
In a sign of how much concern these cases are causing—as well as how much travel to South American beaches occurs in winter months—the European Center for Disease Prevention and Control released a “rapid risk assessment” on Friday. It cautions, “There is currently only ecological evidence of an association between (the virus and the birth defects),” but adds, “a possible causative association cannot be ruled out.” Pregnant women, the EU agency said, should be careful to wear insect repellent and long pants and sleeves, and should try to stay inside behind screened windows.
Meanwhile, Zika virus has only been present in Brazil since April, according to the Pan American Health Organization, and it is new in the Americas, having arrived in Chile just last year. It has a long history in Indonesia and the Pacific—including islands such as Vanuatu, Samoa and the Solomon Islands—and in West Africa. Evidence of past infections, though not current cases, has been found in India and in East Africa as well. It is carried by the mosquito species Aedes aegypti, which is the same mosquito that transmits dengue and chikungunya.
In most of the areas where it has been for a while, Zika causes only mild illness of fever, red eyes, and joint pain—but the joint pain is not so serious as what is caused by dengue, dubbed “breakbone fever.” Zika is rarely fatal. That’s one reason why the Brazil cases have caused such alarm. But in French Polynesia, according to the ECDC, there have recently been “at least 17 cases” of malformed brains in children conceived or born last year and this year. None of the women remembered experiencing any symptoms of Zika; but tests on four of the mothers showed they all had been infected with the virus without knowing it. And separately in Brazil, there has been a spike in cases of Guillain-Barré paralysis in the states where the birth defects, and Zika, are also happening.
Though Zika is a new arrival in the Americas, it is moving quickly, and that’s where North Americans should be concerned. According to the WHO, cases have been found in Suriname, Colombia, and just in the past few weeks, El Salvadorand Guatemala—in other words, moving north through Central America.
And, possibly, further than that: Last Thursday, a Mexican regional newspaper, the Cambio de Michoacán, reported that Mexico’s Minister of Health announced two locally infected cases of Zika in the country. One was in Chiapas, on the border with Guatemala; the other was in the state of Nuevo Leon, which lies close to, and at one point touches, the United States’ border.
(Mexico also had its very first case, in a man who was infected in Colombia, just one week earlier; Crawford Kilian spotted and translated the report. Crof, who lives in Canada, speaks fluent Spanish, so his blog is worth watching for reports on this disease—and many others too.)
What for the US? This needs to be watched. The mosquito that carries Zika, and also dengue and chikungunya, has a wide range in the United States: throughout the South, and as far as New York City. Dengue and chikungunya are increasing in the Americas, and dengue recently became established in Florida. Avoiding these diseases requires doing things that Americans used to take for granted back when insect-borne illnesses were a common concern, which was before DDT eradicated malarial mosquitoes, and before the arrival of rural electrification allowed people to spend the evening inside in air conditioning, instead of lingering on porches to escape houses’ stored heat. That means wearing long sleeves, and insect repellants, and clearing out any pool of water where mosquitoes might linger. We haven’t had to think that way for a long time. But perhaps now we will.
Transforming the Electricity Sector to Meet Our Clean Energy Goals 12/14/15
Electric and natural gas utilities account for more than half of all global- warming pollution associated with fossil fuel consumption in the United States so if we are to meet the ambitious carbon reduction goals from the Paris meeting of the United Nation's Conference on Climate Change (COP21), we must significantly transform America's electric and natural gas sectors. NRDC's new Issue Brief, "A Vision for the Future of the Electric Industry," lays out some important steps in that process.
Utilities are a critical part of the solution and remain the most important - although not the only - investors, long-term system planners, and resource integrators of our electric and natural gas system. Key changes in how they are regulated - some already underway - could significantly change the way they do business and speed up decarbonization of our energy system. And these changes must help customers get the cleaner energy, lower bills, and access to innovative technologies like rooftop solar and electric vehicles (EVs) they want.
Change is underway
The electricity sector is already transforming - led by both technology innovation and policy trends. Our electricity consumption has grown at only half the rate of the U.S. population since 2000 - largely because of energy efficiency (which reduces our need for dirty power plants); over that same period, wind and solar production have grown at a record pace, while their costs continue falling. Other technologies such as advanced energy meters in our buildings, electric vehicles, and demand response (compensating customers for altering the times of their energy use) are changing how the electric grid operates, too.
Meanwhile, new players are entering the marketplace to offer customers alternative energy services and technology options. States are increasingly taking action to curb harmful carbon pollution and the U.S. Environmental Protection Agency's Clean Power Plan to limit power plant emissions is expected to accelerate the trend toward cleaner, more efficient electricity. But these trends, at their current pace, will not get us far enough, fast enough.
All of these positive trends can be significantly accelerated and scaled up if utilities are properly motivated. And the best way to do that?
Diversity in Models with Common Elements
There is no single answer because America's electric utilities come in many different sizes and shapes: public (municipals, cooperatives) and private (investor-owned); vertically integrated (they own their system from generation to wires going into the home) or not; cold and warm weather and everything in between.
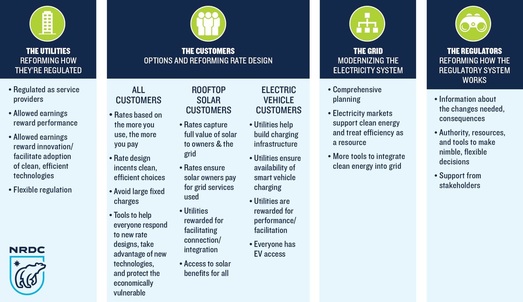
However, there are common elements that are necessary to ensure the cleanest and most efficient, equitable, and affordable electric system possible. These components--which establish incentives for action by utilities, customers, operators of the grid, and regulators-- along with NRDC's vision for the future of the electric industry are here.
On the right track...
We have already made significant progress with one of the most fundamental reforms - changing the utility's principal focus from primarily selling electricity to instead focusing on meeting customers' service needs and our energy and carbon reduction goals. A regulatory rate structure known as revenue decoupling makes utilities indifferent to retail energy sales by using modest annual adjustments in rates to ensure the utility recovers its authorized costs - no more, no less. This helps remove the disincentive for utilities to promote energy efficiency programs like weatherization, which save customers money but reduce utility energy sales. As of December 2015, 15 states had revenue decoupling in place for electric utilities and 22 for natural gas utilities; the number of utilities covered stood at 34 and 55, respectively (three time more than five years earlier).
Solar rooftop systems and EVs are gaining traction due to improved and cheaper technologies and supportive policies. Forty-four states (plus D.C.) have net metering policies in place that compensate customers with rooftop solar panels for sending the excess electricity they generate back to the grid, and this has contributed to a new solar project being installed every two minutes in the first half of 2015 and costs decreasing more than 73 percent from 2006. A new law in California makes replacing oil as the dominant transportation fuel a core mission of the electric industry, recognizing the expanded role utilities should play in supporting public EV charging infrastructure and ensuring EVs provide benefits to the electricity grid. Other utilities across the country are also moving forward with EV investments, including Southern Company and Kansas City Power and Light.
While most transformations are occurring one policy or rate design at a time, a few processes are tackling regulatory reform in a more comprehensive manner, looking at rate design, planning processes and performance-based incentives as a package. New York's Reforming the Energy Vision (REV), Minnesota's E21 Initiative, and California's closely coordinated proceedings are examples.
...with a couple threatened derailments
This past year has seen a threat to our transition to a clean energy future, with a proliferation of utility proposals to institute large fixed charges on customers' monthly utility bills, meaning they'll pay a specific amount no matter how much energy they use. Utilities are looking at these charges to ensure they recover adequate revenues to maintain the electric system, but there are better solutions. Fixed charges reduce rewards to customers for investing in energy efficiency and rooftop solar that can reduce their consumption and bills. At least 35 utilities requested significant increases in fixed charges in 2015, drawing widespread and vehement opposition. But at least 75 percent of the commission decisions in these cases substantially reduced or rejected those increases outright - a very good sign. These rejections are changing the conversation. NRDC's issue brief discusses some of the preferred alternatives that will better incent the efficient use and deployment of utility investments in clean energy.
There is good news in our efforts to decarbonize the electricity and natural gas sectors, but we need more, faster. Transforming the electric industry will help us kick it up a few notches.
Utilities are a critical part of the solution and remain the most important - although not the only - investors, long-term system planners, and resource integrators of our electric and natural gas system. Key changes in how they are regulated - some already underway - could significantly change the way they do business and speed up decarbonization of our energy system. And these changes must help customers get the cleaner energy, lower bills, and access to innovative technologies like rooftop solar and electric vehicles (EVs) they want.
Change is underway
The electricity sector is already transforming - led by both technology innovation and policy trends. Our electricity consumption has grown at only half the rate of the U.S. population since 2000 - largely because of energy efficiency (which reduces our need for dirty power plants); over that same period, wind and solar production have grown at a record pace, while their costs continue falling. Other technologies such as advanced energy meters in our buildings, electric vehicles, and demand response (compensating customers for altering the times of their energy use) are changing how the electric grid operates, too.
Meanwhile, new players are entering the marketplace to offer customers alternative energy services and technology options. States are increasingly taking action to curb harmful carbon pollution and the U.S. Environmental Protection Agency's Clean Power Plan to limit power plant emissions is expected to accelerate the trend toward cleaner, more efficient electricity. But these trends, at their current pace, will not get us far enough, fast enough.
All of these positive trends can be significantly accelerated and scaled up if utilities are properly motivated. And the best way to do that?
Diversity in Models with Common Elements
There is no single answer because America's electric utilities come in many different sizes and shapes: public (municipals, cooperatives) and private (investor-owned); vertically integrated (they own their system from generation to wires going into the home) or not; cold and warm weather and everything in between.
However, there are common elements that are necessary to ensure the cleanest and most efficient, equitable, and affordable electric system possible. These components--which establish incentives for action by utilities, customers, operators of the grid, and regulators-- along with NRDC's vision for the future of the electric industry are here.
On the right track...
We have already made significant progress with one of the most fundamental reforms - changing the utility's principal focus from primarily selling electricity to instead focusing on meeting customers' service needs and our energy and carbon reduction goals. A regulatory rate structure known as revenue decoupling makes utilities indifferent to retail energy sales by using modest annual adjustments in rates to ensure the utility recovers its authorized costs - no more, no less. This helps remove the disincentive for utilities to promote energy efficiency programs like weatherization, which save customers money but reduce utility energy sales. As of December 2015, 15 states had revenue decoupling in place for electric utilities and 22 for natural gas utilities; the number of utilities covered stood at 34 and 55, respectively (three time more than five years earlier).
Solar rooftop systems and EVs are gaining traction due to improved and cheaper technologies and supportive policies. Forty-four states (plus D.C.) have net metering policies in place that compensate customers with rooftop solar panels for sending the excess electricity they generate back to the grid, and this has contributed to a new solar project being installed every two minutes in the first half of 2015 and costs decreasing more than 73 percent from 2006. A new law in California makes replacing oil as the dominant transportation fuel a core mission of the electric industry, recognizing the expanded role utilities should play in supporting public EV charging infrastructure and ensuring EVs provide benefits to the electricity grid. Other utilities across the country are also moving forward with EV investments, including Southern Company and Kansas City Power and Light.
While most transformations are occurring one policy or rate design at a time, a few processes are tackling regulatory reform in a more comprehensive manner, looking at rate design, planning processes and performance-based incentives as a package. New York's Reforming the Energy Vision (REV), Minnesota's E21 Initiative, and California's closely coordinated proceedings are examples.
...with a couple threatened derailments
This past year has seen a threat to our transition to a clean energy future, with a proliferation of utility proposals to institute large fixed charges on customers' monthly utility bills, meaning they'll pay a specific amount no matter how much energy they use. Utilities are looking at these charges to ensure they recover adequate revenues to maintain the electric system, but there are better solutions. Fixed charges reduce rewards to customers for investing in energy efficiency and rooftop solar that can reduce their consumption and bills. At least 35 utilities requested significant increases in fixed charges in 2015, drawing widespread and vehement opposition. But at least 75 percent of the commission decisions in these cases substantially reduced or rejected those increases outright - a very good sign. These rejections are changing the conversation. NRDC's issue brief discusses some of the preferred alternatives that will better incent the efficient use and deployment of utility investments in clean energy.
There is good news in our efforts to decarbonize the electricity and natural gas sectors, but we need more, faster. Transforming the electric industry will help us kick it up a few notches.
Gasoline Explained 12/15/15
Gasoline use contributes to air pollutionGasoline is a toxic and highly flammable liquid. The vapors given off when gasoline evaporates and the substances produced when it is burned (carbon monoxide, nitrogen oxides, particulate matter, and unburned hydrocarbons) contribute to air pollution. Burning gasoline also produces carbon dioxide, a greenhouse gas linked to global climate change.1
Did you know?Burning a gallon of gasoline (that does not contain ethanol) produces about 19.6 pounds of carbon dioxide.
In 2014, total U.S. carbon dioxide emissions from gasoline combustion were about 1,077 million metric tons, approximately 20% of total U.S. energy-related carbon dioxide emissions.
Laws like the Clean Air Act reduce environmental impacts Americans used about 375 million gallons of gasoline per day in 2014. Most gasoline is used in cars, light trucks, and motorcycles, but it is also used in small aircraft, boats, and water craft, and in landscaping and construction equipment. Reducing pollution from these sources has been a focus of environmental laws in the United States.
The Clean Air Act is a law that seeks to reduce air pollution in the United States. The Clean Air Act (first passed in 1970) and its amendments have aimed to reduce pollution from gasoline use by requiring the use of less polluting engines and fuels2, among other items. To meet its goals, the U.S. Environmental Protection Agency (EPA) implemented several changes following the passage of the act:
Methyl tertiary butyl ether (MTBE), one of the chemicals added to gasoline to help it burn cleaner, is toxic, and a number of states started banning the use of MTBE in gasoline in the late 1990s. By 2007, the U.S. refining industry had voluntarily stopped using MTBE when making reformulated gasoline for sale in the United States. MTBE was replaced with ethanol, which is not toxic.
Did you know?Burning a gallon of gasoline (that does not contain ethanol) produces about 19.6 pounds of carbon dioxide.
In 2014, total U.S. carbon dioxide emissions from gasoline combustion were about 1,077 million metric tons, approximately 20% of total U.S. energy-related carbon dioxide emissions.
Laws like the Clean Air Act reduce environmental impacts Americans used about 375 million gallons of gasoline per day in 2014. Most gasoline is used in cars, light trucks, and motorcycles, but it is also used in small aircraft, boats, and water craft, and in landscaping and construction equipment. Reducing pollution from these sources has been a focus of environmental laws in the United States.
The Clean Air Act is a law that seeks to reduce air pollution in the United States. The Clean Air Act (first passed in 1970) and its amendments have aimed to reduce pollution from gasoline use by requiring the use of less polluting engines and fuels2, among other items. To meet its goals, the U.S. Environmental Protection Agency (EPA) implemented several changes following the passage of the act:
- Required emissions control devices and cleaner burning engines—Emissions control devices on passenger vehicles were required beginning in 1976. In the 1990s, the EPA established emissions standards for other types of vehicles and for engines used in gasoline-burning off road equipment.
- Removed leaded gasoline—Lead in gasoline proved to be a public health concern. The move away from leaded gasoline began in 1976 when catalytic converters were installed in new vehicles to reduce the emission of toxic air pollutants. Vehicles equipped with a catalytic converter cannot operate on leaded gasoline because the presence of lead in the fuel damages the catalytic converter. Leaded gasoline was completely phased out of the U.S. fuel system by 1986.
- Required the use of reformulated gasoline—Beginning in 1995, the Clean Air Act Amendments of 1990 required the use of cleaner burning reformulated gasoline to reduce air pollution in metropolitan areas that had significant ground-level ozone pollution.
- Required the supply of low-sulfur gasoline—Since 2006, refiners have been required to supply gasoline with 90% less sulfur content than they made in 2004. More reductions in gasoline sulfur content are planned to begin in 2017. Gasoline with lower sulfur content reduces emissions from old and new vehicles, and it is necessary for advanced vehicle emission control devices to work properly.
- Reduced risk of gasoline leaks—Gasoline leaks happen at gas stations every day. As people fill up their gas tanks, gasoline drips from the nozzle onto the ground and vapors leak from the open gas tank into the air. Gasoline leaks can also happen in pipelines or in underground storage tanks4 where they can't be seen. Beginning in 1990, all underground storage tanks had to be replaced by tanks with double lining. The double lining provides an additional safeguard for preventing leaks.
Methyl tertiary butyl ether (MTBE), one of the chemicals added to gasoline to help it burn cleaner, is toxic, and a number of states started banning the use of MTBE in gasoline in the late 1990s. By 2007, the U.S. refining industry had voluntarily stopped using MTBE when making reformulated gasoline for sale in the United States. MTBE was replaced with ethanol, which is not toxic.
Hope for the trees 12/19/15

UNTIL the 1960s, forest-clearing accounted for most anthropogenic carbon emissions. Now it causes around 10%—a decline that led many at the UN climate summit in Paris to focus their efforts elsewhere. Though Norway, Germany and Britain said they would make a billion dollars a year available for averting tropical deforestation until 2020, America, France and Japan refused to chip in. Australia trumpeted a pro-tree plan of its own, but has not pledged more money for it. There was little mention of Indonesia’s devastating wildfires, or of a 16% uptick in deforestation in Brazil.
Yet the 10% share hugely understates the importance of forests to the fight against climate change. Just as shrinking forests contribute to global warming, growing ones can counter it. During the 2000s tropical forests are estimated to have sopped up and stored carbon equivalent to 22-26% of carbon-dioxide emissions from human activity. Ending tropical deforestation and letting damaged forests recover could cut net emissions by almost a third, creating a space for industrial emissions to fall more slowly.
ReprintsThe Paris agreement failed to create mechanisms, such as carbon markets, that could generate the much larger sums necessary for conservation on that scale. That was expected; on a more realistic measure of progress, forests did pretty well. Reducing deforestation and forest degradation—REDD+, in the jargon—has finally been enshrined as a mainstream climate policy. Over 60 countries included it in their commitments. It got its own clause in the final deal, with an approving nod to ways of designing and running REDD+ schemes agreed on in previous climate talks. Schemes can be funded publicly or privately, with payment for success in leaving trees standing.
Climate change in graphics: The state of the planetWhether REDD+ can fulfil its potential remains unclear. By one measure, the net global deforestation rate has fallen in recent years. Yet, despite improvements in monitoring tropical deforestation and establishing baselines against which it can be measured, REDD+ probably played a minor part. Brazil dislikes the idea of “offsetting”—letting other countries or even firms emit more in return for paying to keep its trees standing. Indonesia has, in effect, downgraded the REDD+ agency it set up in a deal with Norway, and failed to spend most of the billion dollars that the Norwegians provided.
Rich countries say this shows that what is mainly lacking is political will. Those with tropical forests retort that the failure to cough up the large sums they were once promised vindicates their wariness. Both are right: for now, REDD+ is almost as notional as it is necessary.
New kind of Hydrothermal vent forms ghostly chimneys 12/28/15
Deep in the Caribbean Sea, researchers have discovered a new type of hydrothermal vent unlike any seen before, with huge, ghostly mounds formed from an ingredient common in baby powder.
Typical hydrothermal vents consist mostly of sulfide minerals, but these vents in the Von Damm Vent Field south of the Cayman Islands are made mostly of talc, a magnesium-silicate mineral.
"This vent site is home to a community of fauna similar to those found at the Mid-Atlantic Ridge in the Atlantic Ocean," study researcher Matthew Hodgkinson, a postgraduate scientist at the University of Southampton in the United Kingdom, said in a statement, referring to the plate boundary that slices through the Atlantic. "But the minerals and chemistry at the Von Damm site are very different to other known vents."
The underwater geography of the Von Damm Vent Field in the Caribbean.
Credit: National Oceanography Centre
Deep in the Caribbean Sea, researchers have discovered a new type of hydrothermal vent unlike any seen before, with huge, ghostly mounds formed from an ingredient common in baby powder.
Typical hydrothermal vents consist mostly of sulfide minerals, but these vents in the Von Damm Vent Field south of the Cayman Islands are made mostly of talc, a magnesium-silicate mineral.
"This vent site is home to a community of fauna similar to those found at the Mid-Atlantic Ridge in the Atlantic Ocean," study researcher Matthew Hodgkinson, a postgraduate scientist at the University of Southampton in the United Kingdom, said in a statement, referring to the plate boundary that slices through the Atlantic. "But the minerals and chemistry at the Von Damm site are very different to other known vents."
Hydrothermal vents occur in spots where tectonic forces pull the Earth's crust apart like taffy. Magma from below the surface heats water in the crust, dissolving minerals into the seawater. Bizarre ocean creatures, including tube worms, snails and eels, are often drawn to these nutrient-rich sites. [Photos: See Creatures of the Deepest Deep-Sea Vents]
The main vent at the Von Damm Vent Field south of the Cayman Islands. Vents at this field have an unusual mineral composition of 85 percent to 90 percent talc.
Credit: National Oceanography Centre
View full size imageResearchers discovered the Von Damm Vent Field in 2010. The vents are on the western side of the Mid-Cayman Spreading Center, a tectonically active area. Talc mounds up to 246 feet (75 meters) tall loom over the seafloor there.
The vent system is hotter than scientists would expect, given that it is on the edge of the spreading center rather than right in the middle of the action, researchers said. The field transfers approximately 500 megawatts of heat into the surrounding ocean. This heat comes from hot water — 392 degrees Fahrenheit (200 degrees Celsius) — flowing at a rate of about 500 kilograms (1,100 lbs.) per second from the vents, the researchers reported on Dec. 22 in the journal Nature Communications.
When this hot, subsurface water hits the cooler ocean, minerals dissolved in the hot water precipitate out, creating ghostly chimney structures. In the Van Damm vent field, these chimneys are 85 percent to 95 percent talc by volume. Silica and a few sulfide minerals make up the rest of the chimneys' volume.
"If more of these unusual sites exist, they could be important contributors in the exchange of chemicals and heat between the Earth's interior and the oceans, and may be missing from current global assessments of hydrothermal impact on the oceans," Hodgkinson said.
The Van Damm Vent Field sits on the slopes of an underwater mountain called Mount Dent, located 7,546 feet (2,300 m) below the ocean surface. Masses of shrimp crowd the vents, which also host snail species never before found elsewhere. Nearby is the Beebe Vent Field, thedeepest vent ever discovered, at 16,273 feet (4,960 m) below the ocean surface. Those vents are home to flowerlike sea anemones, as well as other deep-sea organisms.
Typical hydrothermal vents consist mostly of sulfide minerals, but these vents in the Von Damm Vent Field south of the Cayman Islands are made mostly of talc, a magnesium-silicate mineral.
"This vent site is home to a community of fauna similar to those found at the Mid-Atlantic Ridge in the Atlantic Ocean," study researcher Matthew Hodgkinson, a postgraduate scientist at the University of Southampton in the United Kingdom, said in a statement, referring to the plate boundary that slices through the Atlantic. "But the minerals and chemistry at the Von Damm site are very different to other known vents."
The underwater geography of the Von Damm Vent Field in the Caribbean.
Credit: National Oceanography Centre
Deep in the Caribbean Sea, researchers have discovered a new type of hydrothermal vent unlike any seen before, with huge, ghostly mounds formed from an ingredient common in baby powder.
Typical hydrothermal vents consist mostly of sulfide minerals, but these vents in the Von Damm Vent Field south of the Cayman Islands are made mostly of talc, a magnesium-silicate mineral.
"This vent site is home to a community of fauna similar to those found at the Mid-Atlantic Ridge in the Atlantic Ocean," study researcher Matthew Hodgkinson, a postgraduate scientist at the University of Southampton in the United Kingdom, said in a statement, referring to the plate boundary that slices through the Atlantic. "But the minerals and chemistry at the Von Damm site are very different to other known vents."
Hydrothermal vents occur in spots where tectonic forces pull the Earth's crust apart like taffy. Magma from below the surface heats water in the crust, dissolving minerals into the seawater. Bizarre ocean creatures, including tube worms, snails and eels, are often drawn to these nutrient-rich sites. [Photos: See Creatures of the Deepest Deep-Sea Vents]
The main vent at the Von Damm Vent Field south of the Cayman Islands. Vents at this field have an unusual mineral composition of 85 percent to 90 percent talc.
Credit: National Oceanography Centre
View full size imageResearchers discovered the Von Damm Vent Field in 2010. The vents are on the western side of the Mid-Cayman Spreading Center, a tectonically active area. Talc mounds up to 246 feet (75 meters) tall loom over the seafloor there.
The vent system is hotter than scientists would expect, given that it is on the edge of the spreading center rather than right in the middle of the action, researchers said. The field transfers approximately 500 megawatts of heat into the surrounding ocean. This heat comes from hot water — 392 degrees Fahrenheit (200 degrees Celsius) — flowing at a rate of about 500 kilograms (1,100 lbs.) per second from the vents, the researchers reported on Dec. 22 in the journal Nature Communications.
When this hot, subsurface water hits the cooler ocean, minerals dissolved in the hot water precipitate out, creating ghostly chimney structures. In the Van Damm vent field, these chimneys are 85 percent to 95 percent talc by volume. Silica and a few sulfide minerals make up the rest of the chimneys' volume.
"If more of these unusual sites exist, they could be important contributors in the exchange of chemicals and heat between the Earth's interior and the oceans, and may be missing from current global assessments of hydrothermal impact on the oceans," Hodgkinson said.
The Van Damm Vent Field sits on the slopes of an underwater mountain called Mount Dent, located 7,546 feet (2,300 m) below the ocean surface. Masses of shrimp crowd the vents, which also host snail species never before found elsewhere. Nearby is the Beebe Vent Field, thedeepest vent ever discovered, at 16,273 feet (4,960 m) below the ocean surface. Those vents are home to flowerlike sea anemones, as well as other deep-sea organisms.
2015 Was 2nd Hottest on Record 1/7/15
2015 is officially in the books as the second-hottest year ever recorded for the U.S., with a major boost provided by the incredible warmth that bathed the eastern half of the country in December, the National Oceanic and Atmospheric Administrationannounced Thursday.
That second-place finish comes as both NOAA and NASA are expected to announce that the year was the hottest on record globally. While that record heat was helped in part by one of the strongest El Ninos on record, it was mainly due to the contributions of manmade global warming, scientists have said.
The U.S. temperature ranking “is emblematic of what will ultimately be the warmest year for the globe,” Deke Arndt, chief of NOAA Climate Monitoring Branch, said during a press conference.
By the end of November, the U.S. was having its fifth hottest year-to-date, but December turned out not only to be record warm, but incredibly so: It was 6°F (3°C) above the 20th century average and bested the previous record holder (December 1939) by nearly a full degree. That surge of heat bumped the year as a whole up to the No. 2 slot in records going back to 1895, with a temperature that was 2.4°F (1.3°C) above the 20th century average. The only year warmer was 2012, by 0.9°F (0.5°C).
RELATEDTwo Charts Show December’s Crazy Warmth
Climate Chart of the Year? Record Heat, Of Course
Florida’s Record Warm 2015 an Outlier in U.S. EastThis was the 19th consecutive year that the overall U.S. temperature exceeded the 20th century average, NOAA said.
December’s warmth was fueled by a combination of the influences of El Nino, climate patterns over the North Atlantic and manmade warming, as winters overall in the U.S. have been heating up. During the month, record warm temperatures outpaced record cold ones by an astounding 21-to-1 ratio, and 29 states had their hottest December on record.
“December 2015 really blew away the competition,” NOAA climatologist Jake Crouch said.
And not only was December record warm, it was also record wet, the first time a month has set both records simultaneously, Crouch said.
While the east baked in December, the west was relatively cool — the opposite of the pattern that prevailed during the first half of the year. During those months, the West roasted under a high-pressure ridge that helped fuel record-breaking drought while the East took repeated blows from outbreaks of Arctic air. The result of that temperature pattern flip was that every state had an above-average annual temperature.
Four states — Florida, Montana, Oregon, and Washington — saw their all-time warmest year, while three more — Alaska, California, and Idaho — had their second warmest. (California had its record warmest year in 2014.) Florida was an outlier in the eastern half of the country for much of the year due to a combination of influences, including drought during the warm spring and summer months and record warm ocean temperatures offshore.
Drought was also a factor in the warmth earlier in the year in the West, but despite the record-breaking levels it reached, the year as a whole was the third wettest on record for the country, behind only 1973 and 1983. Much of that precipitation fell in the central and southeastern parts of the country, such as the torrential rains that caused flooding in Texas and Oklahoma in May and South Carolina in October. Both of these were among the 10 weather and climate disasters that exceeded $1 billion in damage during the year.
“The fact is that we live in a warming world,” Arndt said. “We’re going to be dealing with more extreme heat events and more extreme rainfall events, and I think that really showed up in the results from the year as a whole.”
Global ocean warming has doubled in recent decades, scientists find 1/19/16
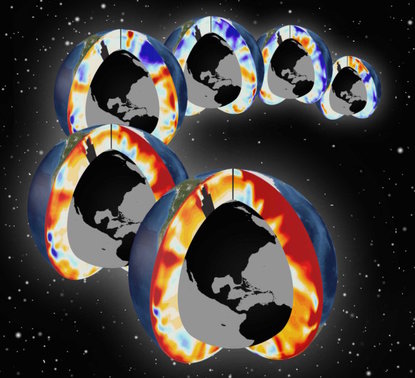 Pacific and Atlantic southern sections showing upper-ocean warming for the past six decades (1955-2011). Red colors indicate warming and blue colors indicate cooling.
Lawrence Livermore scientists, working with National Oceanic and Atmospheric Administration and university colleagues, have found that half of the global ocean heat content increase since 1865 has occurred over the past two decades.
"In recent decades the ocean has continued to warm substantially, and with time the warming signal is reaching deeper into the ocean," said LLNL scientist Peter Gleckler, lead author of a paper published in the journal Nature Climate Change.
Changes in ocean heat storage are important because the ocean absorbs more than 90 percent of Earth's excess heat increase that is associated with global warming. The observed ocean and atmosphere warming is a result of continuing greenhouse gas emissions. Quantifying how much heat is accumulating in Earth system is critical to improving the understanding of climate change already under way and to better assess how much more to expect in decades and centuries to come. It is vital to improving projections of how much and how fast Earth will warm and seas rise in the future.
Increases in upper ocean temperatures since the 1970s are well documented and associated with greenhouse gas emissions. By including measurements from a 19th century oceanographic expedition and recent changes in the deeper ocean, the study indicates that half of the accumulated heat during the industrial era has occurred in recent decades, with about a third residing in the deeper oceans.
The team analyzed a diverse set of ocean temperature observations and a large suite of climate models. Scientists have measured ocean temperatures in a variety of ways over time, from lowering pairs of minimum-maximum thermometers to different depths on lines dangled overboard during the H.M.S. Challenger 1872-1876 expedition, to highly accurate modern instruments used on a global array of robotic profiling floats (called Argo) that "phone home" the data using satellites, starting around 1999.
This study found that estimates of ocean warming over a range of times and depths agree well with results from the latest generation of climate models, building confidence that the climate models are providing useful information. "The year-round, global distribution of ocean temperature data collected by Argo has been key in improving our estimates of ocean warming and assessing climate models," notes LLNL oceanographer Paul Durack.
While Argo only samples the upper half of the ocean volume, pilot arrays of new "Deep Argo" floats that sample to the ocean floor are being deployed. This vast ocean volume in the deeper half is only measured infrequently by research vessels. Those deep data also show warming, even in the bottom layers of the ocean in recent decades.
"Given the importance of the ocean warming signal for understanding our changing climate, it is high time to measure the global ocean systematically from the surface to the ocean floor," said NOAA oceanographer Gregory Johnson.
Impact of human activity on local climate mapped 1/20/16
Earth's temperature has increased by 1°C over the past century, and most of this warming has been caused by carbon dioxide emissions. But what does that mean locally?
A new study published in Nature Climate Change pinpoints the temperature increases caused by CO2 emissions in different regions around the world.
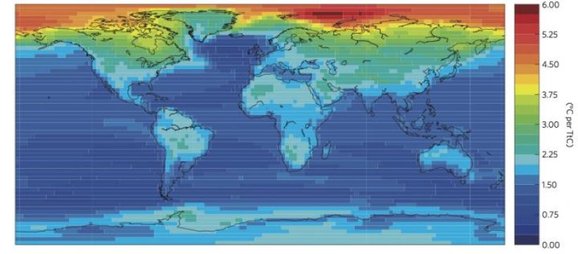
Using simulation results from 12 global climate models, Damon Matthews, a professor in Concordia's Department of Geography, Planning and Environment, along with post-doctoral researcher Martin Leduc, produced a map that shows how the climate changes in response to cumulative carbon emissions around the world.
They found that temperature increases in most parts of the world respond linearly to cumulative emissions.
"This provides a simple and powerful link between total global emissions of carbon dioxide and local climate warming," says Matthews. "This approach can be used to show how much human emissions are to blame for local changes."
Leduc and Matthews, along with co-author Ramon de Elia from Ouranos, a Montreal-based consortium on regional climatology, analyzed the results of simulations in which CO2 emissions caused the concentration of CO2 in the atmosphere to increase by 1 per cent each year until it reached four times the levels recorded prior to the Industrial Revolution.
Globally, the researchers saw an average temperature increase of 1.7 ±0.4°C per trillion tonnes of carbon in CO2 emissions (TtC), which is consistent with reports from the Intergovernmental Panel on Climate Change.
But the scientists went beyond these globally averaged temperature rises, to calculate climate change at a local scale.
At a glance, here are the average increases per trillion tonnes of carbon that we emit, separated geographically:
There are also marked differences between land and ocean, with the temperature increase for the oceans averaging 1.4 ± 0.3°C TtC, compared to 2.2 ± 0.5°C for land areas.
"To date, humans have emitted almost 600 billion tonnes of carbon," says Matthews. "This means that land areas on average have already warmed by 1.3°C because of these emissions. At current emission rates, we will have emitted enough CO¬2 to warm land areas by 2°C within 3 decades."
A new study published in Nature Climate Change pinpoints the temperature increases caused by CO2 emissions in different regions around the world.
Using simulation results from 12 global climate models, Damon Matthews, a professor in Concordia's Department of Geography, Planning and Environment, along with post-doctoral researcher Martin Leduc, produced a map that shows how the climate changes in response to cumulative carbon emissions around the world.
They found that temperature increases in most parts of the world respond linearly to cumulative emissions.
"This provides a simple and powerful link between total global emissions of carbon dioxide and local climate warming," says Matthews. "This approach can be used to show how much human emissions are to blame for local changes."
Leduc and Matthews, along with co-author Ramon de Elia from Ouranos, a Montreal-based consortium on regional climatology, analyzed the results of simulations in which CO2 emissions caused the concentration of CO2 in the atmosphere to increase by 1 per cent each year until it reached four times the levels recorded prior to the Industrial Revolution.
Globally, the researchers saw an average temperature increase of 1.7 ±0.4°C per trillion tonnes of carbon in CO2 emissions (TtC), which is consistent with reports from the Intergovernmental Panel on Climate Change.
But the scientists went beyond these globally averaged temperature rises, to calculate climate change at a local scale.
At a glance, here are the average increases per trillion tonnes of carbon that we emit, separated geographically:
- Western North America 2.4 ± 0.6°C
- Central North America 2.3 ± 0.4°C
- Eastern North America 2.4 ± 0.5°C
- Alaska 3.6 ± 1.4°C
- Greenland and Northern Canada 3.1 ± 0.9°C
- North Asia 3.1 ± 0.9°C
- Southeast Asia 1.5 ± 0.3°C
- Central America 1.8 ± 0.4°C
- Eastern Africa 1.9 ± 0.4°C
There are also marked differences between land and ocean, with the temperature increase for the oceans averaging 1.4 ± 0.3°C TtC, compared to 2.2 ± 0.5°C for land areas.
"To date, humans have emitted almost 600 billion tonnes of carbon," says Matthews. "This means that land areas on average have already warmed by 1.3°C because of these emissions. At current emission rates, we will have emitted enough CO¬2 to warm land areas by 2°C within 3 decades."
The aftermath of 1492: Study shows how Native American depopulation impacted ecology 1/25/16
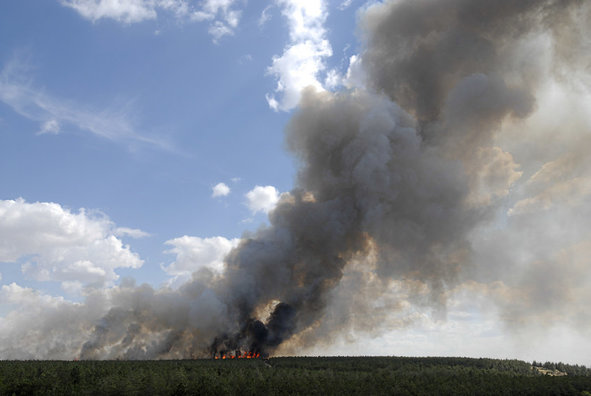 Without humans in the region to clear trees for building materials, heating, cooking, and agriculture, the forest began to reclaim that territory, providing, literally, more fuel for fires.
There is little dispute that in the wake of European colonists' arrival in the New World, Native American populations were decimated by disease and conflict. But when it comes to the timing, magnitude, and effects of this depopulation -- it depends on who you ask.
Many scholars claim that disease struck the native population shortly after their first contact with Europeans, and spread with such ferocity that it left tell-tale fingerprints on the global climate. Others, however, argue that -- though still devastating -- the process was far more gradual, and took place over many years.
A new Harvard study, however, suggests both theories are wrong.
Led by Matt Liebmann, the John and Ruth Hazel Associate Professor of the Social Sciences in the Department of Anthropology, a team of researchers was able to show that, in what is now northern New Mexico, disease didn't break out until nearly a century after the first European contact with Native Americans, coinciding with the establishment of mission churches.
But when it did finally strike, the study shows, the effects of disease were devastating. In just 60 years, native populations dropped from approximately 6,500 to fewer than 900 among the 18 villages they investigated. The study is described in a Jan. 25, 2016 paper published in the Proceedings of the National Academy of Sciences.
In addition to Liebmann, the study was co-authored by Joshua Farella and Thomas Swetnam from the University of Arizona and Christopher Roos from Southern Methodist University.
"In the Southwest, first contact between native people and Europeans occurred in 1539," Liebmann said. "We found that disease didn't really start to take effect until after 1620, but we then see a very rapid depopulation from 1620 to 1680. (The death rate) was staggeringly high -- about 87 percent of the Native population died in that short period.
"Think about what that would mean if you have a room full of people and nine out of 10 die," he continued. "Think of what that means for their social structure, if they're losing the people who know the traditional medicine, their social and religious leaders, think of the huge impact it would have on their culture and history."
The fallout from that depopulation, however, wasn't merely cultural.
"Forest fires also take off during this period," Liebmann said. "When people are living in these villages, they need timber for their roofs, and for heating and cooking. In addition, they're clearing the land for farming, so trees weren't growing there when these archaeological sites were inhabited. But as people died off, the forests started re-growing and we start to see more forest fires."
That finding, he said, also links the study with ongoing debates about whether the world has entered a new geological era -- dubbed the Anthropocene -- marked by the fact that humans have affected the climate on a global scale.
Though there is still wide debate about when this new epoch started, a number of researchers have pointed to 1610, when -- ice core records show -- global CO2 levels dropped dramatically.
"one of the 'Early Anthropocene' theories suggests that because Native Americans were being removed from the landscape on a massive scale, especially in the Amazon, they were no longer burning the forest for agriculture, and as the forest re-grew it sequestered carbon," Liebmann said. "The argument hinges on the notion that the depopulation of the Americas was so extreme that it left its mark on the atmosphere and climate at global scales.
"Our data speaks to a period a little bit later than the dates of low CO2 from the ice cores, but depopulation in the Southwest could have intensified that dip," he added. "The important thing, from my perspective, is that the Southwest was one of the earliest points of contact between Europeans and Native Americans in what later became the U.S., and it hadn't yet experienced a catastrophic depopulation by 1610, so it's hard to argue for it happening anywhere in the rest of North America at that early date."
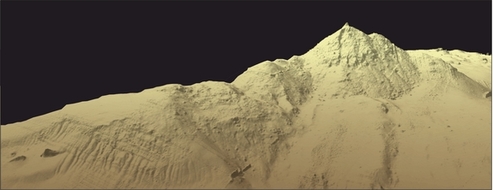
Mapping nearly 20 Native American villages, however, is no easy feat -- many researchers might spend years examining a single site. To pull it off, Liebmann and colleagues turned to a technology known as LiDAR, which uses lasers to penetrate the dense forest cover and create a map of the region that, in some cases, is accurate down to the centimeter.
"I thought my career would be standing on these sites with a (surveying tool called a) total station," Liebmann said. "I've mapped a couple of archaeological sites like this before, and it can take years, but with LiDAR I have the ability to calculate the architecture of 18 villages in an instant. This new technology is what made this study possible."
Armed with that data, Harvard Anthropology graduate student Adam Stack and undergraduate student Sarah Martini were able to calculate the volume of each building and develop an equation to estimate how many people lived in the area.
Dating the sites -- and in particular when villages may have been abandoned as the population dwindled -- is far trickier.
"Usually, we use tree rings to date architecture in the Southwest," Liebmann said. "If someone cuts down a tree to use as a roof beam, archaeologists can look at the tree rings to date it. But for this project we didn't excavate the sites, so we couldn't recover the roof beams. Instead, the dendrochronologists on our team looked at the inner rings of trees that are still growing on these sites to establish when they germinated. They found that tree growth took off between 1630 and 1650. When we get a cluster of dates in the same 20-year period, that tells us that something happened at these villages to start these trees growing there."
What that something was, Liebmann said, was the removal of the native population from the landscape. Without humans in the region to clear trees for building materials, heating, cooking, and agriculture, the forest began to reclaim that territory, providing, literally, more fuel for fires.
"When we looked at the patterns of fires in the tree rings, we could see that up until about 1620, fires were small and sporadic," Liebmann said. "Native American fields were acting as literal fire breaks. But as the forest started re-growing, much more widespread fires occurred. That continued until almost exactly 1900, when a combination of increased livestock grazing and a change in federal forest management policies began to suppress all fires."
Ultimately, Liebmann said, the study shows that understanding how and when depopulation happened, and the ecological fallout from it, is far more complex than researchers have previously thought.
"Our findings support the notion that there was a massive depopulation, but it's not quite as simple as many people have thought before," Liebmann said. "This research also speaks to...current debates in the American West about how we should manage fire risk. What our study shows is that forest fires were being managed by Native people living in dense concentrations on the landscape -- not unlike the situation today in many parts of the Southwest. So there may be some lessons here for contemporary fire management."
Many scholars claim that disease struck the native population shortly after their first contact with Europeans, and spread with such ferocity that it left tell-tale fingerprints on the global climate. Others, however, argue that -- though still devastating -- the process was far more gradual, and took place over many years.
A new Harvard study, however, suggests both theories are wrong.
Led by Matt Liebmann, the John and Ruth Hazel Associate Professor of the Social Sciences in the Department of Anthropology, a team of researchers was able to show that, in what is now northern New Mexico, disease didn't break out until nearly a century after the first European contact with Native Americans, coinciding with the establishment of mission churches.
But when it did finally strike, the study shows, the effects of disease were devastating. In just 60 years, native populations dropped from approximately 6,500 to fewer than 900 among the 18 villages they investigated. The study is described in a Jan. 25, 2016 paper published in the Proceedings of the National Academy of Sciences.
In addition to Liebmann, the study was co-authored by Joshua Farella and Thomas Swetnam from the University of Arizona and Christopher Roos from Southern Methodist University.
"In the Southwest, first contact between native people and Europeans occurred in 1539," Liebmann said. "We found that disease didn't really start to take effect until after 1620, but we then see a very rapid depopulation from 1620 to 1680. (The death rate) was staggeringly high -- about 87 percent of the Native population died in that short period.
"Think about what that would mean if you have a room full of people and nine out of 10 die," he continued. "Think of what that means for their social structure, if they're losing the people who know the traditional medicine, their social and religious leaders, think of the huge impact it would have on their culture and history."
The fallout from that depopulation, however, wasn't merely cultural.
"Forest fires also take off during this period," Liebmann said. "When people are living in these villages, they need timber for their roofs, and for heating and cooking. In addition, they're clearing the land for farming, so trees weren't growing there when these archaeological sites were inhabited. But as people died off, the forests started re-growing and we start to see more forest fires."
That finding, he said, also links the study with ongoing debates about whether the world has entered a new geological era -- dubbed the Anthropocene -- marked by the fact that humans have affected the climate on a global scale.
Though there is still wide debate about when this new epoch started, a number of researchers have pointed to 1610, when -- ice core records show -- global CO2 levels dropped dramatically.
"one of the 'Early Anthropocene' theories suggests that because Native Americans were being removed from the landscape on a massive scale, especially in the Amazon, they were no longer burning the forest for agriculture, and as the forest re-grew it sequestered carbon," Liebmann said. "The argument hinges on the notion that the depopulation of the Americas was so extreme that it left its mark on the atmosphere and climate at global scales.
"Our data speaks to a period a little bit later than the dates of low CO2 from the ice cores, but depopulation in the Southwest could have intensified that dip," he added. "The important thing, from my perspective, is that the Southwest was one of the earliest points of contact between Europeans and Native Americans in what later became the U.S., and it hadn't yet experienced a catastrophic depopulation by 1610, so it's hard to argue for it happening anywhere in the rest of North America at that early date."
Mapping nearly 20 Native American villages, however, is no easy feat -- many researchers might spend years examining a single site. To pull it off, Liebmann and colleagues turned to a technology known as LiDAR, which uses lasers to penetrate the dense forest cover and create a map of the region that, in some cases, is accurate down to the centimeter.
"I thought my career would be standing on these sites with a (surveying tool called a) total station," Liebmann said. "I've mapped a couple of archaeological sites like this before, and it can take years, but with LiDAR I have the ability to calculate the architecture of 18 villages in an instant. This new technology is what made this study possible."
Armed with that data, Harvard Anthropology graduate student Adam Stack and undergraduate student Sarah Martini were able to calculate the volume of each building and develop an equation to estimate how many people lived in the area.
Dating the sites -- and in particular when villages may have been abandoned as the population dwindled -- is far trickier.
"Usually, we use tree rings to date architecture in the Southwest," Liebmann said. "If someone cuts down a tree to use as a roof beam, archaeologists can look at the tree rings to date it. But for this project we didn't excavate the sites, so we couldn't recover the roof beams. Instead, the dendrochronologists on our team looked at the inner rings of trees that are still growing on these sites to establish when they germinated. They found that tree growth took off between 1630 and 1650. When we get a cluster of dates in the same 20-year period, that tells us that something happened at these villages to start these trees growing there."
What that something was, Liebmann said, was the removal of the native population from the landscape. Without humans in the region to clear trees for building materials, heating, cooking, and agriculture, the forest began to reclaim that territory, providing, literally, more fuel for fires.
"When we looked at the patterns of fires in the tree rings, we could see that up until about 1620, fires were small and sporadic," Liebmann said. "Native American fields were acting as literal fire breaks. But as the forest started re-growing, much more widespread fires occurred. That continued until almost exactly 1900, when a combination of increased livestock grazing and a change in federal forest management policies began to suppress all fires."
Ultimately, Liebmann said, the study shows that understanding how and when depopulation happened, and the ecological fallout from it, is far more complex than researchers have previously thought.
"Our findings support the notion that there was a massive depopulation, but it's not quite as simple as many people have thought before," Liebmann said. "This research also speaks to...current debates in the American West about how we should manage fire risk. What our study shows is that forest fires were being managed by Native people living in dense concentrations on the landscape -- not unlike the situation today in many parts of the Southwest. So there may be some lessons here for contemporary fire management."
An Epidemic 14 Years Ago Shows How Zika Could Unfold in the US 1/25/16
If the Zika virus comes to the United States, we could face the threat of the same sort of virgin soil epidemic—an infection arriving in a population that has never been exposed to it before—that has caused more than 1 million known infections, and probably several million asymptomatic ones, in Central and South America. It’s nerve-wracking to wonder what that would be like: How many people would fall ill, how serious the effects would be in adults or in babies, and most important, how good a job we would do of protecting ourselves.
But, in fact, we can guess what it would be like. Because we have a good example, not that long ago, of a novel mosquito-borne threat that caused very serious illness arriving in the United States. And the data since its arrival shows that, despite catching on fairly quickly to what was happening, the U.S. didn’t do that good a job.
This possibility became more real Monday when the Pan American Health Organization released a statement that predicts Zika virus, the mosquito-borne disease that is exploding in South and Central America and seems likely to be causing an epidemic of birth defects especially in Brazil, will spread throughout the Americas. PAHO, which is a regional office of the World Health Organization, said:
There are two main reasons for the virus’s rapid spread (to 21 countries and territories): (1) the population of the Americas had not previously been exposed to Zika and therefore lacks immunity, and (2) Aedes mosquitoes—the main vector for Zika transmission—are present in all the region’s countries except Canada and continental Chile.
PAHO anticipates that Zika virus will continue to spread and will likely reach all countries and territories of the region where Aedesmosquitoes are found.
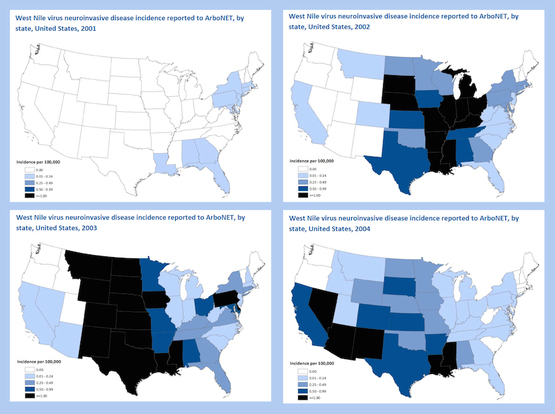
Those “countries and territories where Aedes mosquitoes are found” include a good portion of the United States, as these maps from the Centers for Disease Control and Prevention demonstrate:
The recent history is this: In the summer of 1999, the New York City health department put together reports that had come in from several doctors in the city and realized that an outbreak of encephalitis was moving through the area. Eight people who lived in one neighborhood were ill, four of them so seriously that they had to be put on respirators; five had what their doctors described as “profound muscle weakness.”
Within a month, 37 people had been identified with the perplexing syndrome, which seemed be caused by a virus, and four had died. At the same time, veterinarians at the Bronx Zoo discovered an unusual numbers of dead birds: exotics, like flamingos, and city birds, primarily crows. Their alertness provided the crucial piece for the CDC to realize that a novel disease had landed in the United States: West Nile virus, which was well-known in Europe, but had never been seen in this country before.
West Nile is transmitted by mosquitoes in a complex interplay with birds. It began moving with both birds and bugs down the East Coast and then across the Gulf Coast. As it went, the CDC realized that the neurologic illness that marked the disease’s first arrival had not been a one-time event, but its own looming epidemic within the larger one. “Neuroinvasive” West Nile, which in its worst manifestations caused not transient encephalitis but long-lasting floppyparalysis that resembled polio — and sometimes killed — bloomed in the summer of 2002 east of the Mississippi, and then moved west in the years afterward as the disease exhausted the pool of the vulnerable.
So far, so normal, for a newly arrived disease. But here’s where the story gets complicated. By the beginning of this decade, West Nile had become endemic in the lower 48 states. It is not a mysterious new arrival; it is a known, life-alteringthreat. Its risk waxes and wanes with weather and insect populations, but it has one simple preventative: not allowing yourself to be bitten by a mosquito.
And yet: Here are the CDC’s most recent maps of neuroinvasive West Nile—showing that people are still falling to its most dire complication, 14 years after it was identified.
The point here is not that people are careless or unthinking; in the early years of West Nile, two of the victims were the husband of the CDC’s then director, and the chief of its mosquito-borne diseases division, who would have been well aware of the risks. (Both recovered fully.) The point is that always behaving in a manner that protects you from a mosquito bite—conscientiously, persistently, faultlessly emptying pots and puddles, putting on long sleeves and repellent, choosing when not to go outdoors—is very difficult to maintain.
Zika is not West Nile. Among other things, Zika is spread by many fewer species of mosquitoes — one or possibly two, compared to 65 for West Nile. And West Nile’s non-human hosts, birds, live in closer proximity to more of us than Zika’s, which appear to be non-human primates. But though the rare, deadly complications of West Nile virus infection are different from those of Zika, they are just as serious and life-altering — and yet we failed to protect ourselves from them. As Zika spreads, we can hope that is a lesson we learn in time.
But, in fact, we can guess what it would be like. Because we have a good example, not that long ago, of a novel mosquito-borne threat that caused very serious illness arriving in the United States. And the data since its arrival shows that, despite catching on fairly quickly to what was happening, the U.S. didn’t do that good a job.
This possibility became more real Monday when the Pan American Health Organization released a statement that predicts Zika virus, the mosquito-borne disease that is exploding in South and Central America and seems likely to be causing an epidemic of birth defects especially in Brazil, will spread throughout the Americas. PAHO, which is a regional office of the World Health Organization, said:
There are two main reasons for the virus’s rapid spread (to 21 countries and territories): (1) the population of the Americas had not previously been exposed to Zika and therefore lacks immunity, and (2) Aedes mosquitoes—the main vector for Zika transmission—are present in all the region’s countries except Canada and continental Chile.
PAHO anticipates that Zika virus will continue to spread and will likely reach all countries and territories of the region where Aedesmosquitoes are found.
Those “countries and territories where Aedes mosquitoes are found” include a good portion of the United States, as these maps from the Centers for Disease Control and Prevention demonstrate:
The recent history is this: In the summer of 1999, the New York City health department put together reports that had come in from several doctors in the city and realized that an outbreak of encephalitis was moving through the area. Eight people who lived in one neighborhood were ill, four of them so seriously that they had to be put on respirators; five had what their doctors described as “profound muscle weakness.”
Within a month, 37 people had been identified with the perplexing syndrome, which seemed be caused by a virus, and four had died. At the same time, veterinarians at the Bronx Zoo discovered an unusual numbers of dead birds: exotics, like flamingos, and city birds, primarily crows. Their alertness provided the crucial piece for the CDC to realize that a novel disease had landed in the United States: West Nile virus, which was well-known in Europe, but had never been seen in this country before.
West Nile is transmitted by mosquitoes in a complex interplay with birds. It began moving with both birds and bugs down the East Coast and then across the Gulf Coast. As it went, the CDC realized that the neurologic illness that marked the disease’s first arrival had not been a one-time event, but its own looming epidemic within the larger one. “Neuroinvasive” West Nile, which in its worst manifestations caused not transient encephalitis but long-lasting floppyparalysis that resembled polio — and sometimes killed — bloomed in the summer of 2002 east of the Mississippi, and then moved west in the years afterward as the disease exhausted the pool of the vulnerable.
So far, so normal, for a newly arrived disease. But here’s where the story gets complicated. By the beginning of this decade, West Nile had become endemic in the lower 48 states. It is not a mysterious new arrival; it is a known, life-alteringthreat. Its risk waxes and wanes with weather and insect populations, but it has one simple preventative: not allowing yourself to be bitten by a mosquito.
And yet: Here are the CDC’s most recent maps of neuroinvasive West Nile—showing that people are still falling to its most dire complication, 14 years after it was identified.
The point here is not that people are careless or unthinking; in the early years of West Nile, two of the victims were the husband of the CDC’s then director, and the chief of its mosquito-borne diseases division, who would have been well aware of the risks. (Both recovered fully.) The point is that always behaving in a manner that protects you from a mosquito bite—conscientiously, persistently, faultlessly emptying pots and puddles, putting on long sleeves and repellent, choosing when not to go outdoors—is very difficult to maintain.
Zika is not West Nile. Among other things, Zika is spread by many fewer species of mosquitoes — one or possibly two, compared to 65 for West Nile. And West Nile’s non-human hosts, birds, live in closer proximity to more of us than Zika’s, which appear to be non-human primates. But though the rare, deadly complications of West Nile virus infection are different from those of Zika, they are just as serious and life-altering — and yet we failed to protect ourselves from them. As Zika spreads, we can hope that is a lesson we learn in time.
Thawing permafrost, climate change's ticking time bomb? 11/20/15
On the front line of climate change in the Canadian Arctic, scientists are hunting for clues to a potentially catastrophic global warming trend: melting permafrost, a layer of soil or rock that is - or should be - frozen all year round. Video provided by AFP
How much damage is the Porter Ranch leak doing to the climate? 1/24/16
Sephen Conley has flown pollution-detecting airplanes over some of the largest oil and gas fields in the nation. But never before has the UC Davis scientist encountered as much methane in the air as in recent months over suburban Los Angeles.
Over and over, Conley has flown his single-engine plane through the invisible plume billowing from an underground natural gas storage facility and into Porter Ranch to provide California air quality officials estimates of the planet-warming emissions from the leak.
Regulators order new steps to contain gas leak near Porter Ranch On the first flight, in November, methane levels above the community jumped to 50 parts per million, so high that Conley double-checked his instruments in disbelief.
"This is probably 20 times bigger than anything else we've measured," Conley said.
In three months, one failed well at Southern California Gas Co.'s Aliso Canyon storage field has spewed more greenhouse gases than any other facility in California. At its height, the leak more than doubled the methane emissions of the entire Los Angeles Basin and surpassed what is released by all industrial activity in the state.
Experts say the release of so much methane, a fast-acting greenhouse gas many times more powerful than carbon dioxide, means that the biggest environmental consequence of the leak will be its effect in boosting global warming. Long after the leak stops and the foul odors vanish, the pulse of methane will remain in the atmosphere and its damage to the climate will go on.
State regulators and scientists studying the leak warn that the longer the gas escapes into the air, the more it will work against California's progress fighting climate change, including the target announced by Gov. Jerry Brown last year to reduce emissions of methane and other short-lived climate pollutants by 40% or more by the year 2030.
"It's really moving us in the wrong direction," said Jorn Herner, chief of research planning, administration and emissions mitigation at the state Air Resources Board.
Once the leak is stopped, air quality officials plan to complete a detailed estimate of its methane emissions using computer models and data from a network of gas analyzers on towers and buildings throughout the region. It will take months to complete an accurate measurement.
Until then, Conley's measurements, though considered rough estimates, are the best indication of the climate effects from the ongoing leak. They are taken about once a week and paid for by the gas company.
If there is any good news, it is that they show the leak rate has been declining since its peak on Nov. 28, when the well released 58,000 kilograms of methane per hour. By Thursday the rate had dropped by two-thirds to 18,400 kilograms per hour.
The utility attributed the decline to its increased withdrawals of gas from the underground reservoir, "which is helping reduce the pressure that is pushing the gas up the well and out of the leak," gas company spokeswoman Kristine Lloyd said in an email.
As a result, she said, the reservoir has gone from being 90% full before the leak to at most 37% full on Jan. 10.
The utility does not have an estimate of the amount of gas released and says it cannot complete one until after the leak has stopped.
Porter Ranch gas leak Crews are drilling a relief well to seal off the damaged one, with work expected to be completed by late February. Earlier this month the gas company abandoned a plan to capture and burn the leaking methane after regulators raised concerns about safety and explosion risk.
The utility has pledged to make up for its harm to the climate.
Brown has ordered state officials to draft a plan for the gas company to offset the emissions by funding projects in California to curb fast-acting climate pollutants such as methane.
"Those are significant but reasonable constraints," said Gary Gero, senior advisor to Climate Action Reserve, a leading certifier of carbon offsets. He said the emissions from the leak are so great that the gas company would have difficulty finding enough certified offsets to cover them.
The utility would not otherwise be required to pay for its pollution because California's climate change regulations exempt methane leaks — even enormous ones — as "fugitive emissions" that are not subject to the state's cap-and-trade program.
So far, estimates show the leak has put out the equivalent of 2.1 million metric tons of carbon dioxide — more greenhouse gas than 440,000 cars emit in a year. Because the surge of pollution is in the form of methane, it will have a more immediate heat-trapping effect on the atmosphere.Natural gas consists mostly of methane. Health officials say mercaptan and other odorants added to the gas are responsible for the symptoms being reported by Porter Ranch residents, including headache and nausea. The gas also contains compounds such as benzene that can increase cancer risk through long-term exposure.
State regulators and scientists monitoring methane from the leak throughout the Los Angeles region emphasized the gas is not at concentrations that pose a health or safety risk to residents.
But its fingerprint is evident far and wide, said Riley Duren, a researcher at NASA's Jet Propulsion Laboratory in La Cañada Flintridge. A network of gas-detecting instruments across the basin, including one sensor atop Mt. Wilson, has detected noticeable increases in methane levels as far away as Orange County and San Clemente Island, he said.
Duren thinks estimates gathered by airplane represent a "reasonable lower bound" and that total methane emissions from the leak could be higher.
The methane is leaking from one of 115 wells at the company's sprawling facility in the Santa Susana Mountains, which stores natural gas for use across Southern California. With a capacity of 86 billion cubic feet, it's one of the largest of more than 400 natural gas storage fields around the nation.
This is a massive leak, but it's not altogether unexpected.- Jessika Trancik, assistant professor of energy studies at Massachusetts Institute of TechnologyThe incident is likely to affect regulations under development by state and federal environmental agencies to reduce methane emissions from oil and gas operations.
"This is a massive leak, but it's not altogether unexpected," said Jessika Trancik, assistant professor of energy studies at Massachusetts Institute of Technology, who evaluates the climate effects of natural gas-related emissions.
That's because of a growing recognition that the nation's natural gas infrastructure is vulnerable to leaks and other failures, particularly as it ages, Trancik said.
"It's inevitable that parts of the supply infrastructure will fail, but the impacts of these kinds of events can be contained if we have more comprehensive monitoring and better predictions of which sites are at risk," she said
Studies in recent years have found emissions in the industry are significantly underestimated by official inventories. Experts blame widespread leakage, with some estimating that between 2% and 4% of the natural gas in the nation escapes into the air at some point in the production, transmission and distribution system.
Companies have spent millions in recent years improving monitoring and tightening up equipment to reduce the risks to the climate and the public, said Rob Jackson, environmental scientist at Stanford University.
"One accident like this wipes out those benefits over the past year and more," said Jackson, who is studying the Aliso Canyon leak and thinks it is probably one of the largest in the last 50 years.
State officials might have more quickly understood the severity of the leak if they had measured its emissions earlier. The first aerial measurements came more than two weeks after the leak was reported by the gas company on Oct. 23. The Air Resources Board said it wasn't notified of the leak until Nov. 5.
Reports submitted to the state agency show that pilot Conley made his first attempt to measure emissions from the leak the same day, working for the advocacy group Environmental Defense Fund. But Conley was sent home.
"During the two-hour flight to the site at the northern edge of the Los Angeles metro area,EDF was dissuaded from the measurement by personnel from SoCal Gas, citing extreme danger," according to a report by the pilot. Just before reaching the facility, the environmental group ordered him to turn around, Conley said.
Conley returned two days later, under contract with the state, to complete the first successful emissions measurements.
"That's when we discovered this absurd level," Conley said.
The Air Resources Board released its first estimate of the greenhouse gas emissions nearly two weeks later, after what officials called an extensive review of the data.
The agency's Nov. 20 report found that the stricken well was boosting California's methane emissions by about 25%, underscoring "the urgency of stopping the gas leak."